Revenue Cycle by Design: A Multi-Facility Modeling
Designed and generated a dataset of 250,000 claims in Python using rule-based operational and financial logic, then normalized the raw output into schemas with Power Query and analyze reimbursement performance, denials, efficiency, and profitability.
Business questions
- How are A/R loads and collection rates tracking month over month?
- Which payers generate the highest write-off burden per encounter?
- Where are denial rates concentrated, by provider, CPT, or payer?
- How does reimbursement compare to allowed revenue across encounter types?
Approach
- Cleaned and transformed raw billing data using Python and Power Query
- MPRR reductions and standardized adjustment coding
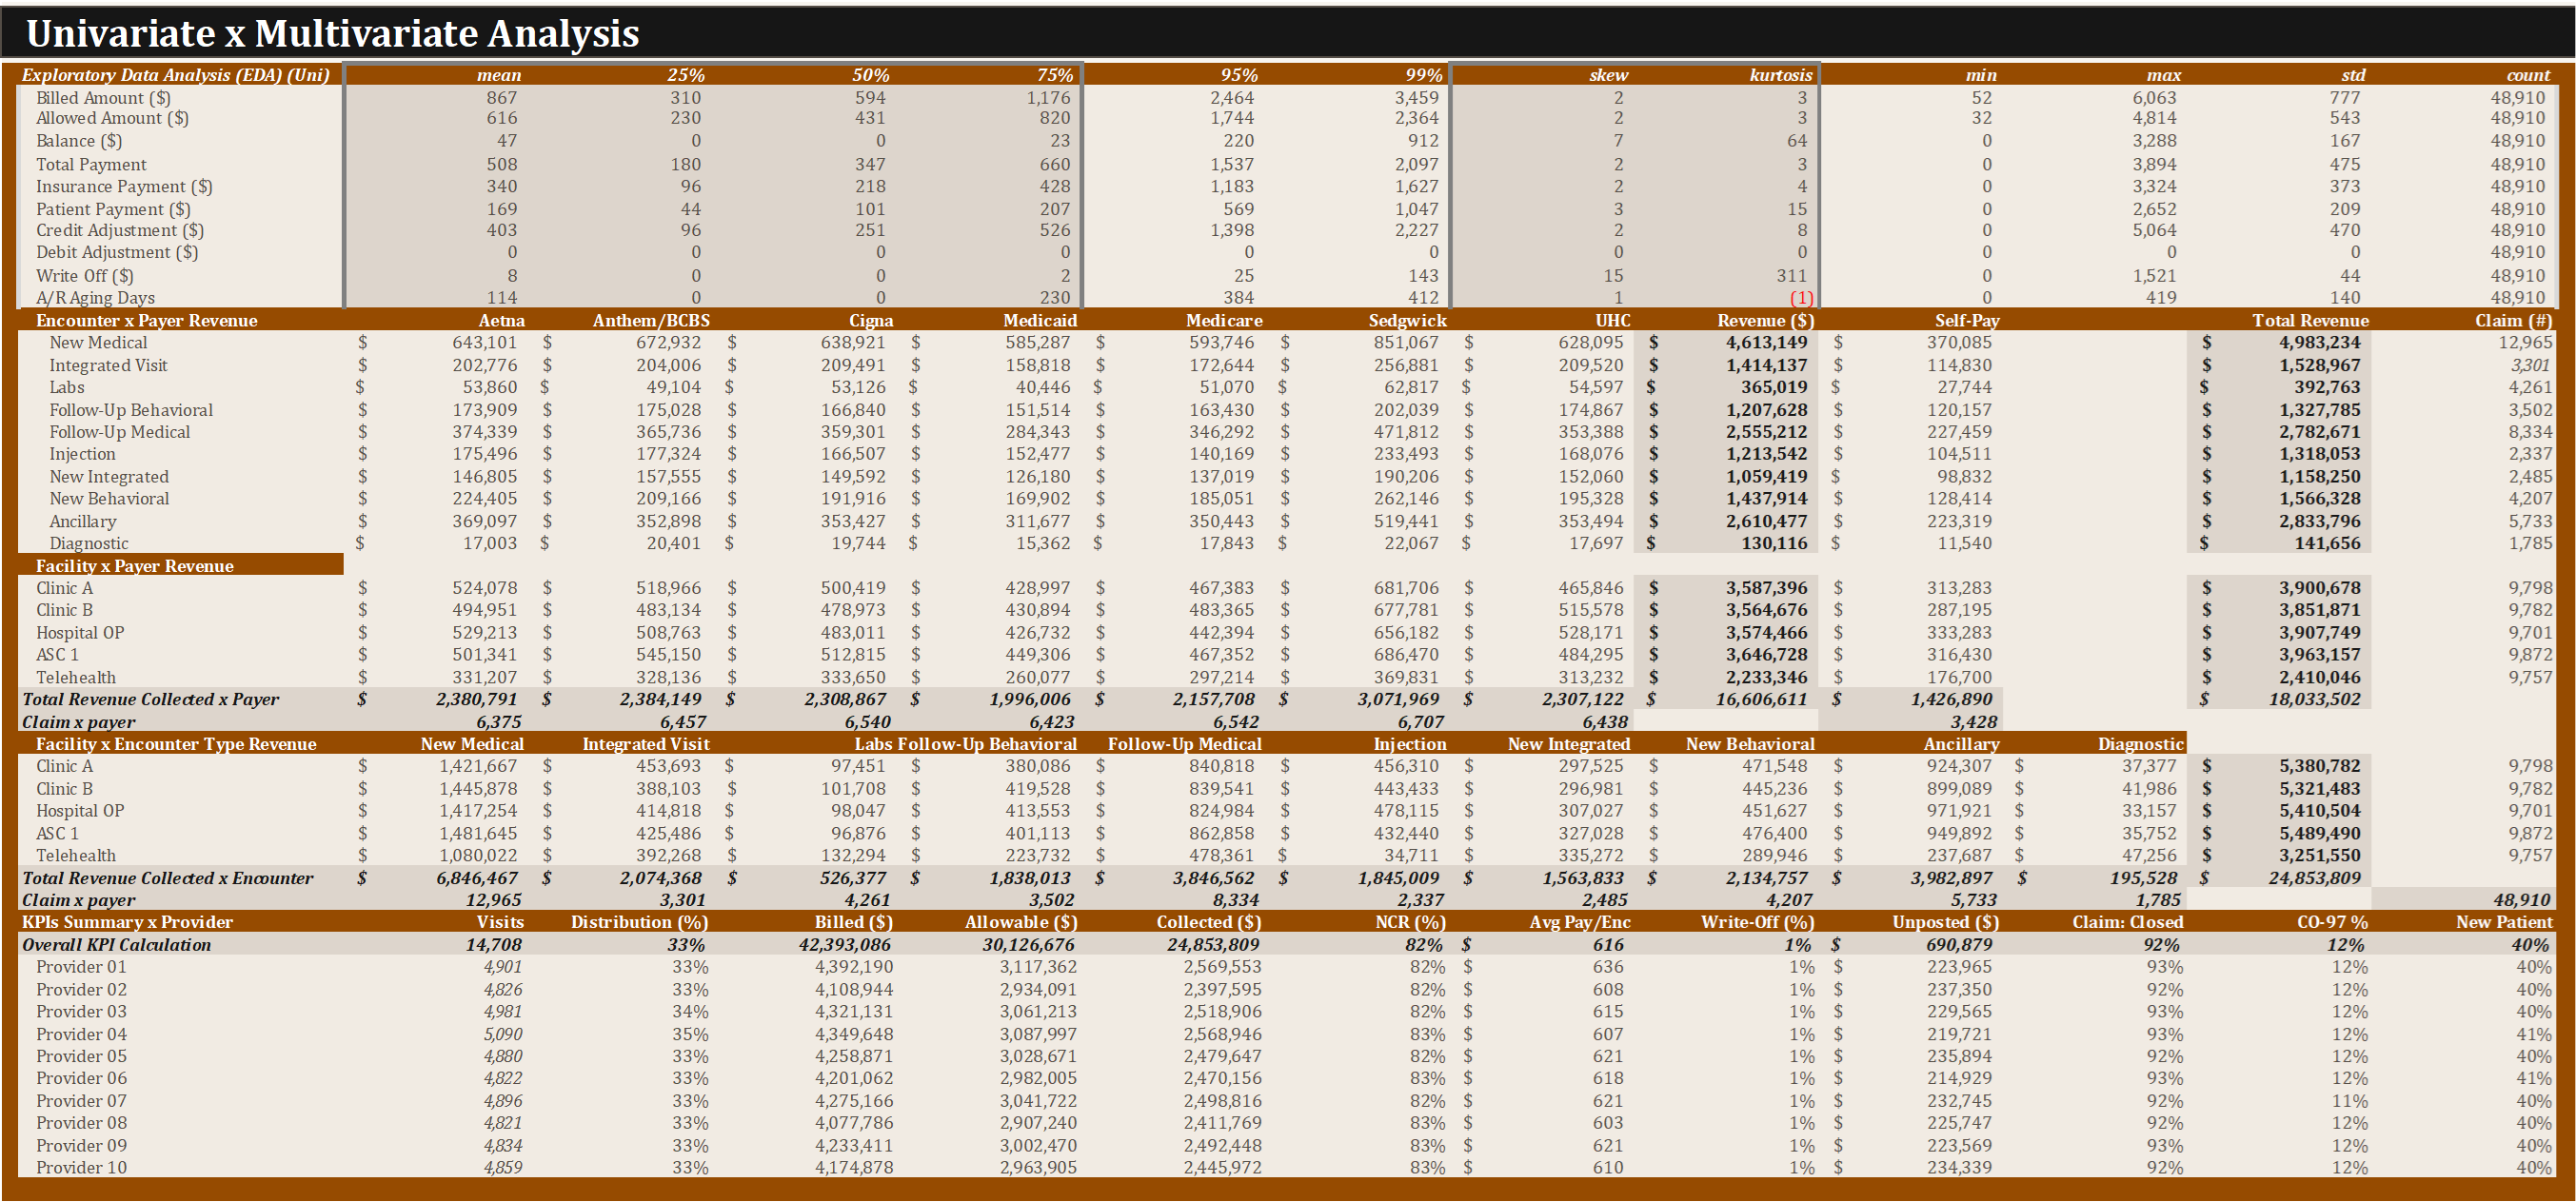
- Built univariate and multivariate analysis across payer and encounter dimensions
- Designed an interactive Excel dashboard with slicers for payer, month, and provider
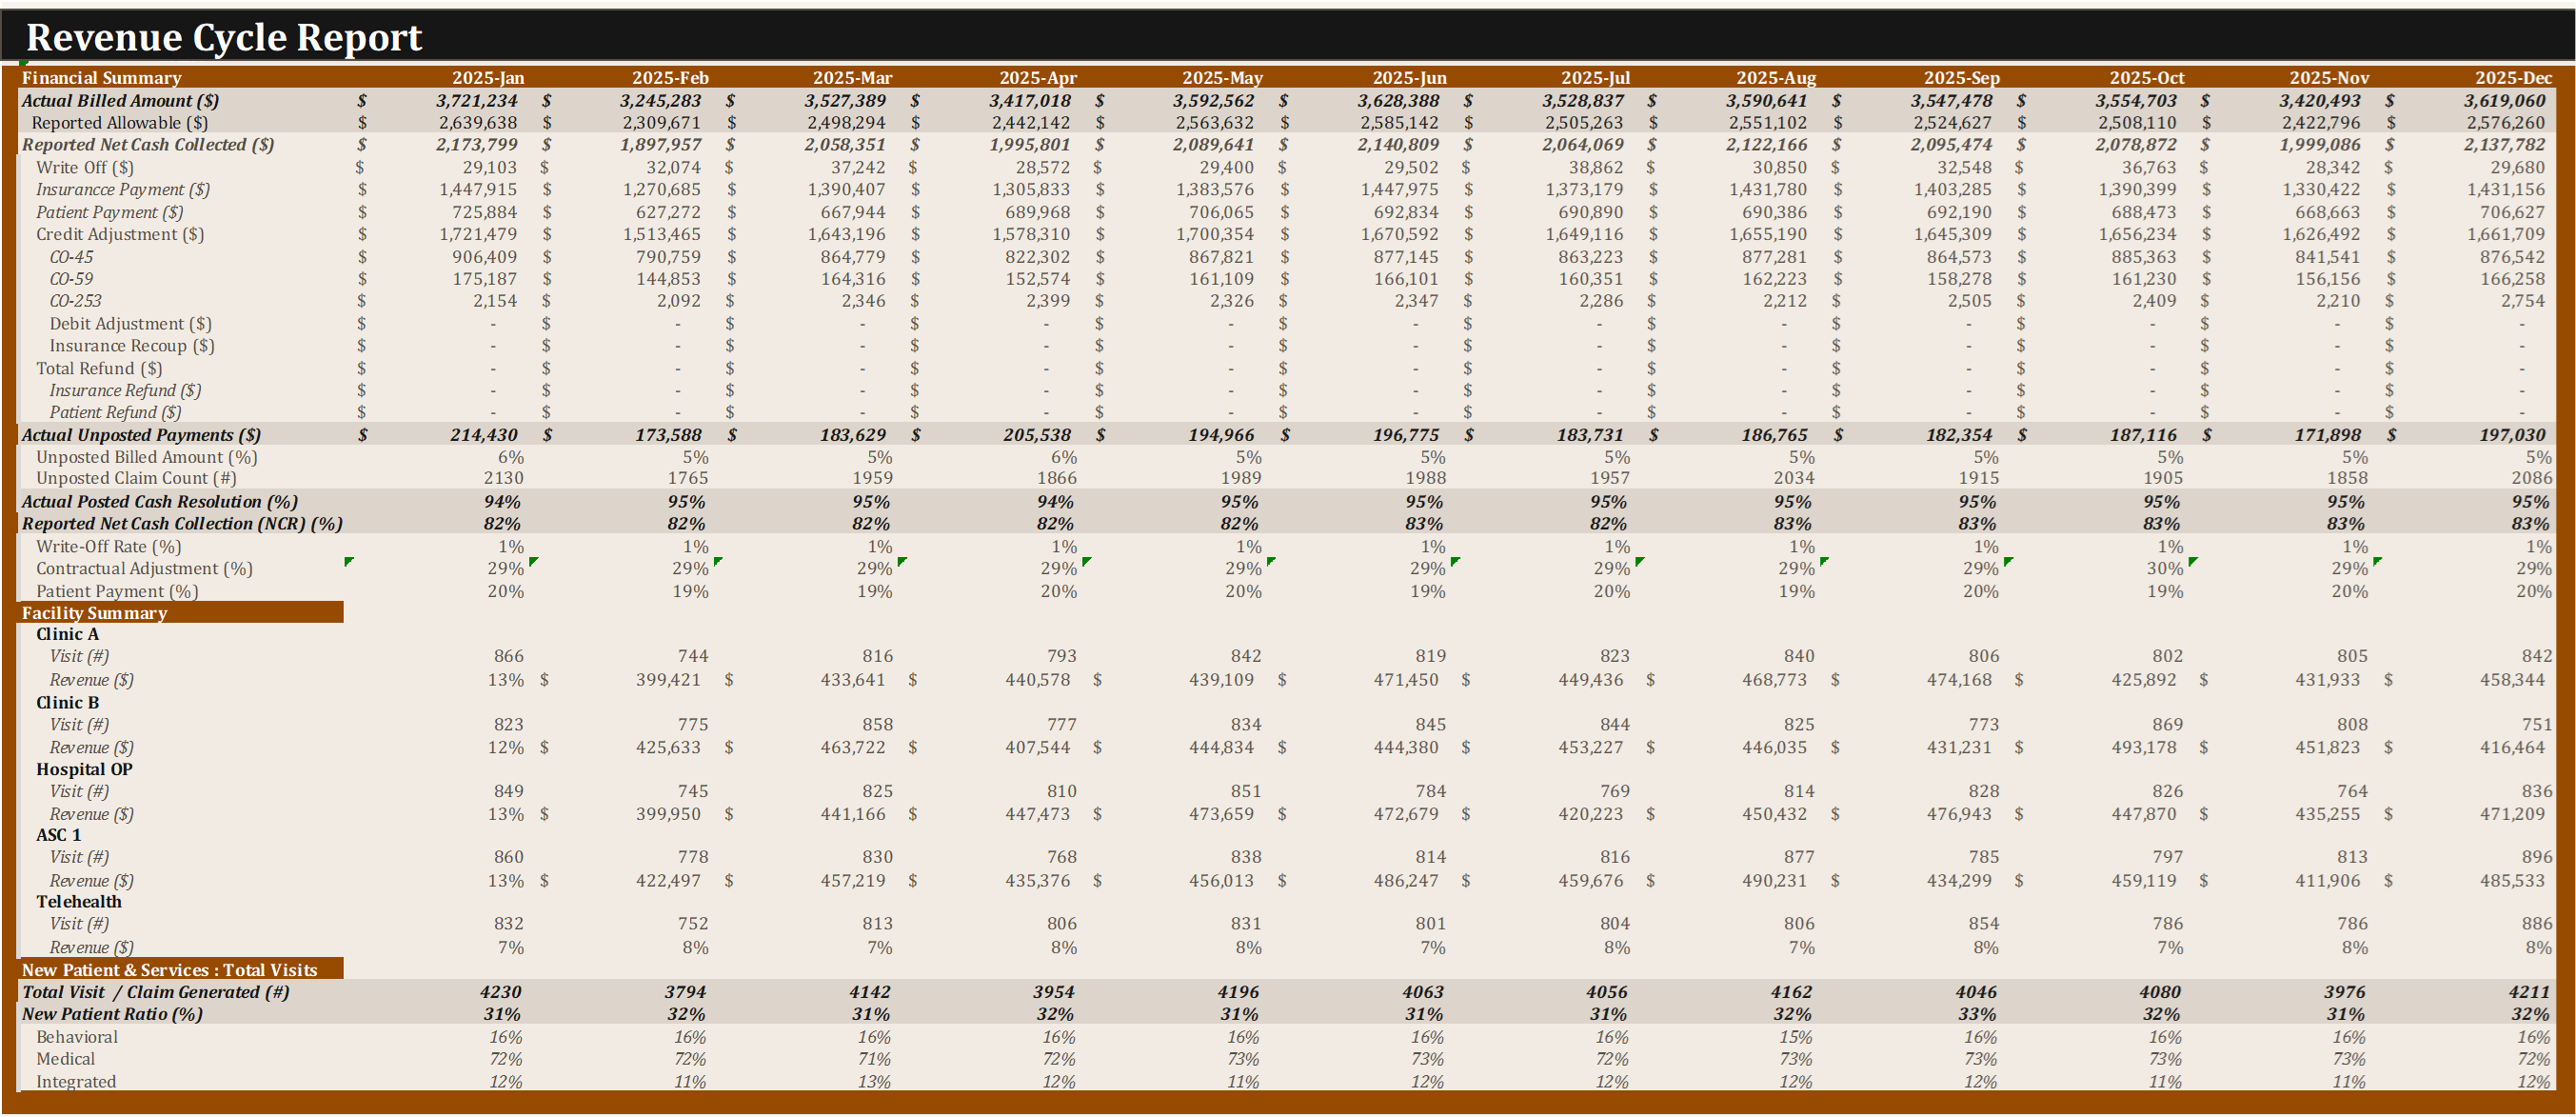
- Produced a comprehensive billing report with provider-level KPIs
Key metrics
- Reimbursement totals and reimbursement rate
- Denial volume and denial trends
- Operational efficiency indicators
- Profitability comparison
Outcome
Produced a reporting tool that enables comparison of performance drivers and demonstrates how reimbursement patterns, denials, and operational processes influence financial outcomes.